
Circuit Documentation
Summary
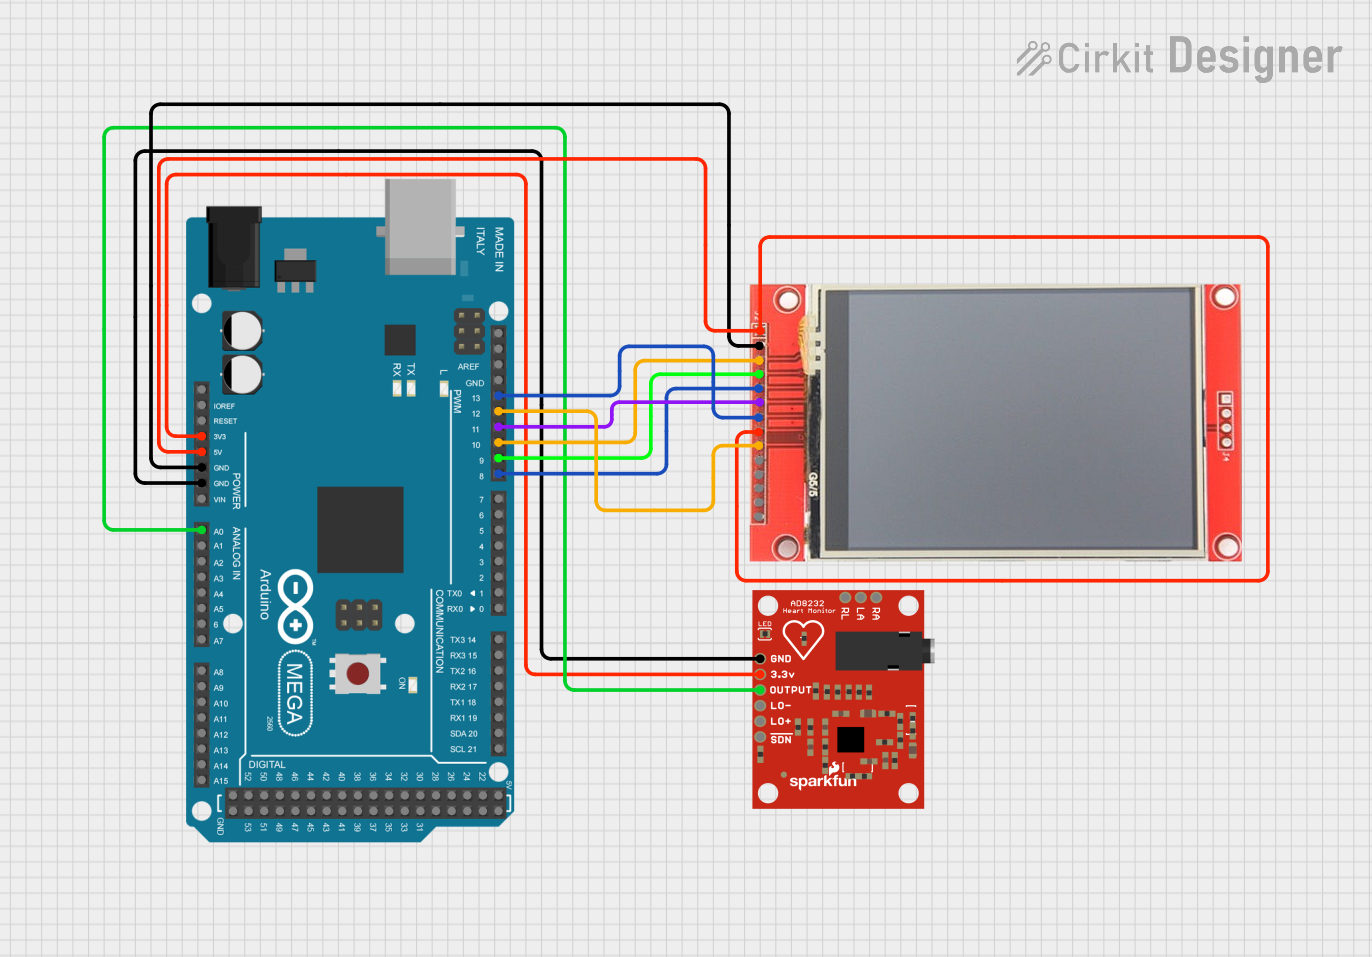
This circuit integrates an Arduino Mega 2560 microcontroller with an AD8232 Heart Rate Monitor and an ili9341 TFT display. The purpose of the circuit is to read heart rate data from the AD8232 sensor, process it with the Arduino, and display the results on the TFT screen. The Arduino Mega 2560 also controls the display's operation, including initialization and drawing of graphical elements such as grids and text.
Component List
Arduino Mega 2560
- Description: A microcontroller board based on the ATmega2560.
- Purpose: Acts as the central processing unit for the circuit, reading sensor data, running the main program, and controlling the TFT display.
AD8232 Heart Rate Monitor
- Description: A single-lead heart rate monitor.
- Purpose: Measures electrical activity of the heart (ECG) and outputs an analog signal.
ili9341 TFT Display
- Description: A 320x240 pixel color display with SPI interface.
- Purpose: Displays the heart rate data and graphical representation of the ECG.
Wiring Details
Arduino Mega 2560
3V3connected to AD8232 Heart Rate Monitor3.3v5Vconnected to ili9341 TFT DisplayVCCandLEDGNDconnected to AD8232 Heart Rate MonitorGNDand ili9341 TFT DisplayGNDA0connected to AD8232 Heart Rate MonitorOUTPUTD8 PWMconnected to ili9341 TFT DisplayDC/RSD9 PWMconnected to ili9341 TFT DisplayRESETD10 PWMconnected to ili9341 TFT DisplayCSD11 PWMconnected to ili9341 TFT DisplaySDID12 PWMconnected to ili9341 TFT DisplaySDOD13 PWMconnected to ili9341 TFT DisplaySCK
AD8232 Heart Rate Monitor
3.3vconnected to Arduino Mega 25603V3GNDconnected to Arduino Mega 2560GNDOUTPUTconnected to Arduino Mega 2560A0
ili9341 TFT Display
VCCconnected to Arduino Mega 25605VLEDconnected to Arduino Mega 25605VGNDconnected to Arduino Mega 2560GNDDC/RSconnected to Arduino Mega 2560D8 PWMRESETconnected to Arduino Mega 2560D9 PWMCSconnected to Arduino Mega 2560D10 PWMSDIconnected to Arduino Mega 2560D11 PWMSDOconnected to Arduino Mega 2560D12 PWMSCKconnected to Arduino Mega 2560D13 PWM
Documented Code
#include "SPI.h"
#include "Adafruit_GFX.h"
#include "Adafruit_ILI9341.h"

// Screen dimensions
#define SCREEN_WIDTH 320
#define SCREEN_HEIGHT 350

// Color definitions for the grid
#define MINOR_GRID tft.color565(100, 100, 255)
#define MAJOR_GRID tft.color565(0, 0, 255)
#define GRID_EDGE tft.color565(255, 0, 0)
#define V_CENTER tft.color565(255, 0, 0)
#define H_CENTER tft.color565(255, 0, 0)

// Pin definitions for the TFT display
#define TFT_CS         10
#define TFT_DC         8
//#define TFT_LED      5v
#define TFT_RST        9
#define TFT_MOSI       11
#define TFT_CLK        13
#define TFT_MISO       12

// Create TFT display object
Adafruit_ILI9341 tft = Adafruit_ILI9341(TFT_CS, TFT_DC, TFT_MOSI, TFT_CLK, TFT_RST, TFT_MISO);

// Variables for plotting data
int x=0;
int lastx=0;
int lasty=150;

// Variables for BPM calculation
int LastTime=0;
bool BPMTiming=false;
bool BeatComplete=false;
int BPM=0;

// Thresholds for detecting a heartbeat
#define UpperThreshold 550
#define LowerThreshold 500

// Variables for display dimensions
int lebar;
int tinggi;
int geser = 0;

void setup() {
  // Initialize the display
  tft.begin();
  tft.fillScreen(ILI9341_BLACK);
  tft.setTextSize(2);
  tft.setRotation(1);
  drawGrid();
  Serial.begin(9600);
}

void loop() {
  // Update display dimensions
  lebar = tft.width();
  tinggi = tft.height();
  // Draw a red line at the center of the display
  tft.drawLine(0,115,lebar,115,ILI9341_RED);

  // Clear the display and redraw the grid when reaching the end
  if(x > lebar)  {
    tft.fillRect(0,80,320,75,ILI9341_BLACK);
    x=0;
    lastx=x;
    drawGrid();
  }

  // Read ECG data from the heart rate monitor
  int dataecg = analogRead(A0);

  // Plot the ECG data on the display
  int y = 150 - ( dataecg / 10 );
  tft.drawLine(lastx,lasty,x,y,ILI9341_WHITE);
  lasty = y;
  lastx = x;

  // BPM calculation logic
  if( dataecg > UpperThreshold ) {
    if(BeatComplete) {
      BPM=millis()-LastTime;
      BPM=int(60/(float(BPM)/1000));
      BPMTiming=false;
      BeatComplete=false;
    }
    if(BPMTiming==false) {
      LastTime=millis();
      BPMTiming=true;
    }
  }
  if((dataecg < LowerThreshold)&(BPMTiming))
    BeatComplete=true;

  // Display BPM on the screen
  tft.setCursor(5, 10);
  tft.setTextColor(ILI9341_YELLOW,ILI9341_BLACK);
  tft.print("BPM: ");
  tft.print(BPM);
  tft.print("   ");

  // Increment the x position for the next data point
  x = x + 3;
}

// Function to draw the grid on the display
void drawGrid() {
  // Draw minor grid lines
  for (int v = 5; v < SCREEN_WIDTH; v += 10) {
    tft.drawFastVLine(v, 0, SCREEN_HEIGHT, MINOR_GRID);
  }
  for (int h = 5; h < SCREEN_HEIGHT; h += 10) {
    tft.drawFastHLine(0, h, SCREEN_HEIGHT, MINOR_GRID);
  }

  // Draw major grid lines
  for (int v = 10; v < SCREEN_WIDTH; v += 10) {
    tft.drawFastVLine(v, 0, SCREEN_HEIGHT, MAJOR_GRID);
  }
  for (int h = 10; h < SCREEN_HEIGHT; h += 10) {
    tft.drawFastHLine(0, h, SCREEN_HEIGHT, MAJOR_GRID);
  }

  // Draw edge lines
  tft.drawFastVLine(0, 0, SCREEN_HEIGHT - 1, GRID_EDGE);
  tft.drawFastVLine(SCREEN_WIDTH - 1, 0, SCREEN_HEIGHT - 1, GRID_EDGE);
  tft.drawFastHLine(0, 0, SCREEN_WIDTH - 1, GRID_EDGE);
  tft.drawFastHLine(0, SCREEN_HEIGHT - 1, SCREEN_HEIGHT - 1, GRID_EDGE);

  // Draw center lines
  tft.drawFastVLine(SCREEN_WIDTH / 2, 0, SCREEN_HEIGHT, V_CENTER);
}
This code is designed to run on the Arduino Mega 2560 and interfaces with the ili9341 TFT display to graphically represent ECG data from the AD8232 Heart Rate Monitor. It includes functions for initializing the display, drawing a grid for the ECG data, and plotting the data points as they are read from the sensor. The code also calculates and displays the beats per minute (BPM) based on the ECG signal.