Arduino UNO Based Heart Rate and Blood Oxygen Monitor with MAX30102 Sensor

Circuit Documentation
Summary
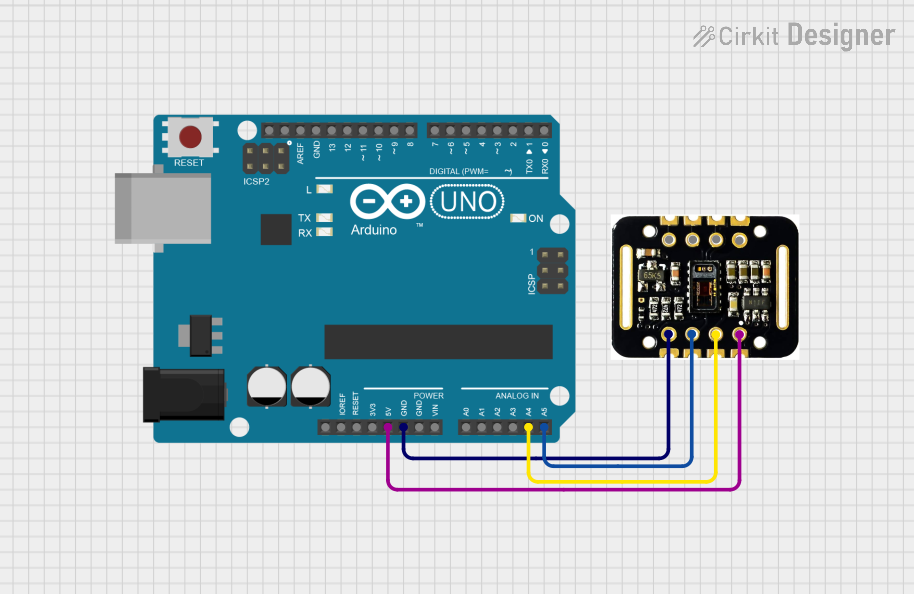
This circuit integrates an Arduino UNO with a MAX30102 Heart Rate (HR) and Blood Oxygen (SpO2) sensor to measure and display the user's heart rate. The MAX30102 sensor interfaces with the Arduino UNO via I2C communication protocol, using the SDA and SCL lines. The sensor is powered by the 5V output from the Arduino, and both devices share a common ground. The heart rate data is processed by the Arduino and can be visualized in real-time using the Arduino's serial plotter.
Component List
Arduino UNO
- Description: A microcontroller board based on the ATmega328P.
- Pins: UNUSED, IOREF, Reset, 3.3V, 5V, GND, Vin, A0-A5, SCL, SDA, AREF, D0-D13.
- Purpose: Acts as the central processing unit for the circuit, reads data from the MAX30102 sensor, and outputs the heart rate data to the serial plotter.
MAX30102 HR + SpO2 Sensor
- Description: An integrated pulse oximetry and heart rate monitor sensor module.
- Pins: INT, IRD, RD, GND, SCL, SDA, VIN.
- Purpose: Measures the blood oxygen saturation and heart rate of the user.
Wiring Details
Arduino UNO
- 5V: Provides power to the MAX30102 sensor.
- GND: Connected to the ground pin of the MAX30102 sensor to establish a common ground.
- A4 (SDA): I2C data line connected to the SDA pin of the MAX30102 sensor.
- A5 (SCL): I2C clock line connected to the SCL pin of the MAX30102 sensor.
MAX30102 HR + SpO2 Sensor
- VIN: Receives power from the 5V output of the Arduino UNO.
- GND: Connected to the ground pin of the Arduino UNO to establish a common ground.
- SDA: I2C data line connected to the A4 (SDA) pin of the Arduino UNO.
- SCL: I2C clock line connected to the A5 (SCL) pin of the Arduino UNO.
- INT: Interrupt pin, not connected in this circuit.
Documented Code
/*
  Heart beat plotting!
  By: Nathan Seidle @ SparkFun Electronics
  Date: October 20th, 2016
  https://github.com/sparkfun/MAX30105_Breakout

  Shows the user's heart beat on Arduino's serial plotter

  Instructions:
  1) Load code onto Redboard
  2) Attach sensor to your finger with a rubber band (see below)
  3) Open Tools->'Serial Plotter'
  4) Make sure the drop down is set to 115200 baud
  5) Checkout the blips!
  6) Feel the pulse on your neck and watch it mimic the blips

  It is best to attach the sensor to your finger using a rubber band or other tightening
  device. Humans are generally bad at applying constant pressure to a thing. When you
  press your finger against the sensor it varies enough to cause the blood in your
  finger to flow differently which causes the sensor readings to go wonky.

  Hardware Connections (Breakoutboard to Arduino):
  -5V = 5V (3.3V is allowed)
  -GND = GND
  -SDA = A4 (or SDA)
  -SCL = A5 (or SCL)
  -INT = Not connected

  The MAX30105 Breakout can handle 5V or 3.3V I2C logic. We recommend powering the board with 5V
  but it will also run at 3.3V.
*/

#include <Wire.h>
#include "MAX30105.h"

MAX30105 particleSensor;

void setup()
{
  Serial.begin(115200);
  Serial.println("Initializing...");

  // Initialize sensor
  if (!particleSensor.begin(Wire, I2C_SPEED_FAST)) //Use default I2C port, 400kHz speed
  {
    Serial.println("MAX30105 was not found. Please check wiring/power. ");
    while (1);
  }

  //Setup to sense a nice looking saw tooth on the plotter
  byte ledBrightness = 0x1F; //Options: 0=Off to 255=50mA
  byte sampleAverage = 8; //Options: 1, 2, 4, 8, 16, 32
  byte ledMode = 3; //Options: 1 = Red only, 2 = Red + IR, 3 = Red + IR + Green
  int sampleRate = 100; //Options: 50, 100, 200, 400, 800, 1000, 1600, 3200
  int pulseWidth = 411; //Options: 69, 118, 215, 411
  int adcRange = 4096; //Options: 2048, 4096, 8192, 16384

  particleSensor.setup(ledBrightness, sampleAverage, ledMode, sampleRate, pulseWidth, adcRange); //Configure sensor with these settings

  //Arduino plotter auto-scales annoyingly. To get around this, pre-populate
  //the plotter with 500 of an average reading from the sensor

  //Take an average of IR readings at power up
  const byte avgAmount = 64;
  long baseValue = 0;
  for (byte x = 0 ; x < avgAmount ; x++)
  {
    baseValue += particleSensor.getIR(); //Read the IR value
  }
  baseValue /= avgAmount;

  //Pre-populate the plotter so that the Y scale is close to IR values
  for (int x = 0 ; x < 500 ; x++)
    Serial.println(baseValue);
}

void loop()
{
  Serial.println(particleSensor.getIR()); //Send raw data to plotter
}
This code initializes the MAX30102 sensor and sets up the Arduino to read IR values from the sensor. It then outputs these values to the serial plotter, allowing for real-time visualization of the user's heart rate. The code includes detailed comments explaining each step and the purpose of the various settings.