How to Use Bar Graph (Wokwi Compatible): Examples, Pinouts, and Specs
Introduction
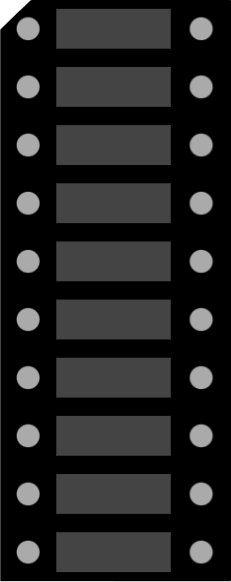
A Bar Graph display, often used in conjunction with microcontrollers like Arduino, is a visual representation tool consisting of a series of Light Emitting Diodes (LEDs) aligned in a row. This electronic component is ideal for creating simple visual indicators that display the level or magnitude of a certain quantity, such as sound level, battery charge, or any other measurable parameter. Bar Graph displays are commonly found in consumer electronics, industrial control panels, and hobbyist projects for a quick and intuitive readout of system status.
Explore Projects Built with Bar Graph (Wokwi Compatible)
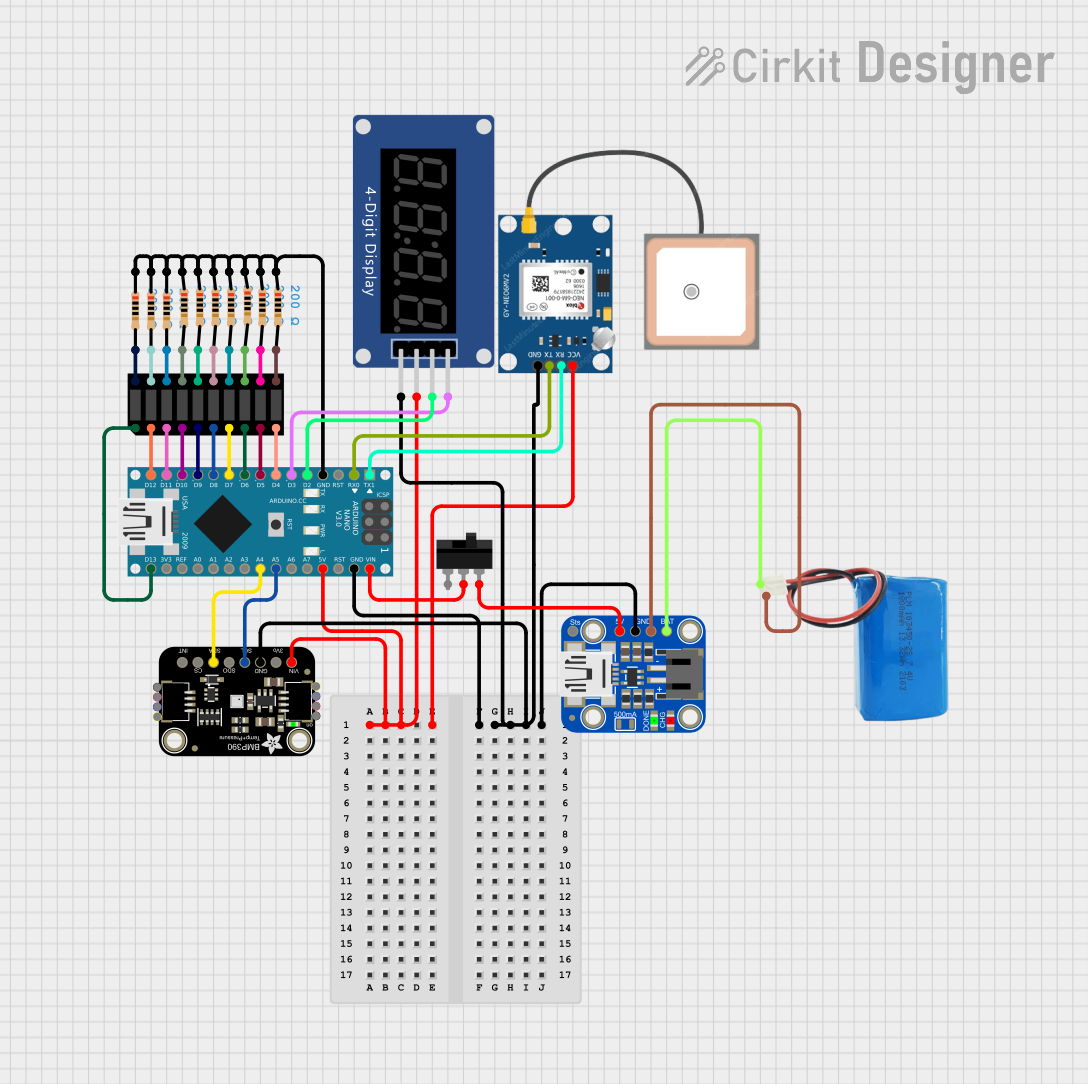
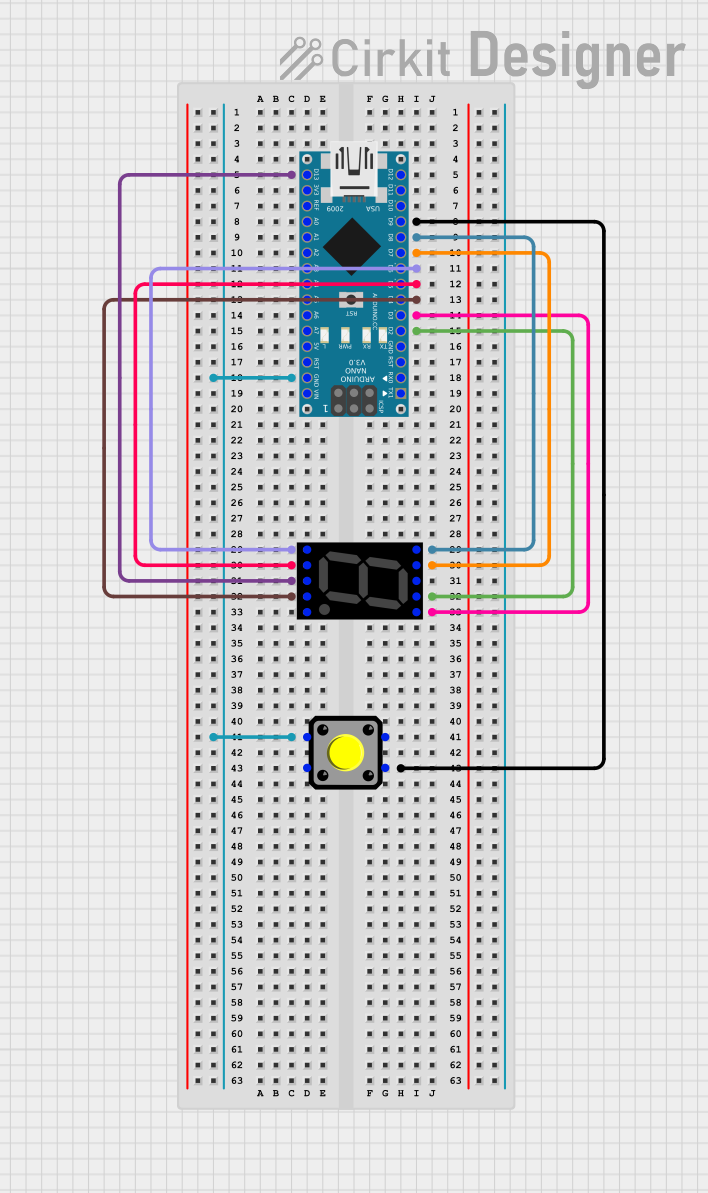

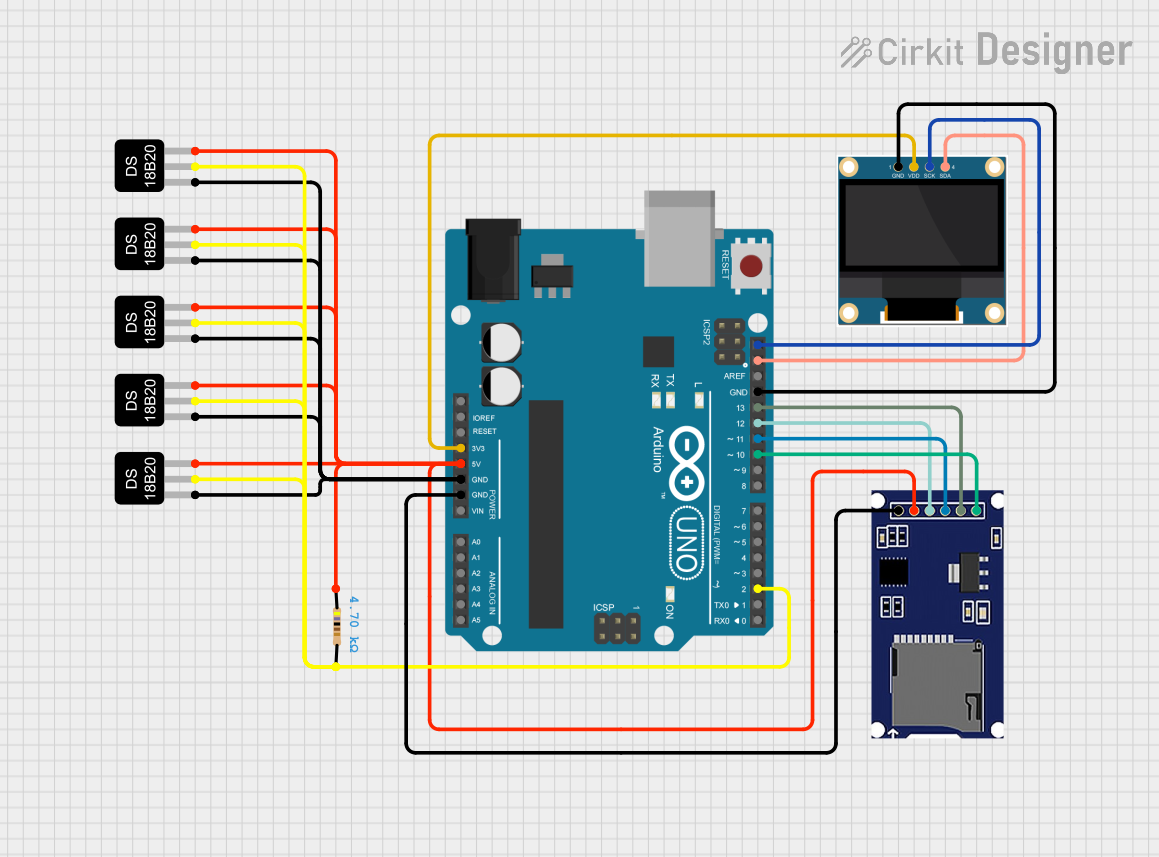
Explore Projects Built with Bar Graph (Wokwi Compatible)
Technical Specifications
Key Technical Details
- Operating Voltage: Typically 2.0V to 2.5V per LED
- Forward Current: Usually around 10mA to 20mA per LED
- Power Ratings: Dependent on the number of LEDs and their individual ratings
- Display Colors: Red, Green, Yellow, Blue (varies by model)
- Number of LEDs: Commonly 10, but can vary
Pin Configuration and Descriptions
| Pin Number | Description | Notes |
|---|---|---|
| 1 | Anode/Cathode of LED1 | Direction depends on model |
| 2 | Anode/Cathode of LED2 | Direction depends on model |
| ... | ... | ... |
| n | Anode/Cathode of LEDn | n is the total number of LEDs |
| Common | Common Anode/Cathode | Shared anode or cathode pin |
Note: The pin configuration may vary depending on the manufacturer and model of the bar graph display. Always refer to the datasheet of the specific component you are using.
Usage Instructions
How to Use the Component in a Circuit
- Identify the Type: Determine whether your bar graph is common anode or common cathode. This will dictate how you power the LEDs.
- Connect to Power: Connect the common pin to either VCC (for common cathode) or GND (for common anode).
- Resistor Selection: Place a current-limiting resistor in series with each LED to prevent damage. Calculate the resistor value using Ohm's law:
R = (V_supply - V_LED) / I_LED. - Control Pins: Connect the remaining pins to the microcontroller's digital output pins.
- Programming: Write a program to control the individual LEDs, turning them on or off to represent the desired data level.
Important Considerations and Best Practices
- Ensure that the power supply voltage does not exceed the maximum rating for the LEDs.
- Always use current-limiting resistors to prevent LED burnout.
- Consider using a driver IC if you need to control a large number of LEDs or if you are limited by the number of available microcontroller pins.
- To increase the lifespan of the LEDs, avoid running them at their maximum current rating.
Example Code for Arduino UNO
// Define the pin connections to the bar graph
const int barGraphPins[] = {2, 3, 4, 5, 6, 7, 8, 9, 10, 11}; // Example for a 10-LED bar graph
const int numLeds = 10; // Number of LEDs in the bar graph

void setup() {
  // Set all the bar graph pins as outputs
  for (int i = 0; i < numLeds; i++) {
    pinMode(barGraphPins[i], OUTPUT);
  }
}

void loop() {
  // Example: Light up the bar graph LEDs one by one
  for (int i = 0; i < numLeds; i++) {
    digitalWrite(barGraphPins[i], HIGH); // Turn on the LED
    delay(100); // Wait for 100 milliseconds
    digitalWrite(barGraphPins[i], LOW); // Turn off the LED
  }
}
Note: The above code assumes a common anode configuration. If you have a common cathode bar graph, you would set the pins LOW to turn on the LEDs and HIGH to turn them off.
Troubleshooting and FAQs
Common Issues
- LEDs Not Lighting Up: Check the power supply and ensure that the common pin is connected correctly. Verify that each LED has a current-limiting resistor and that all connections are secure.
- Dim LEDs: Ensure that the supply voltage is adequate and that the current-limiting resistors are not too high in value.
- LED Burnout: This can occur if the current-limiting resistors are not used or are of an incorrect value. Double-check the resistor calculations and connections.
Solutions and Tips for Troubleshooting
- Always start by checking the simplest components of the circuit, such as power supply and connections.
- Use a multimeter to verify that the correct voltage is present at each LED pin.
- If one LED is not working, check for a faulty LED or a bad solder joint at that position.
FAQs
Q: Can I control a bar graph display with PWM? A: Yes, you can use PWM to control the brightness of the LEDs in the bar graph.
Q: How do I choose the right current-limiting resistor? A: Use Ohm's law to calculate the resistor value based on the supply voltage, the forward voltage of the LED, and the desired forward current.
Q: Can I use a bar graph display with a 3.3V system? A: Yes, but ensure that the forward voltage of the LEDs is compatible with the 3.3V supply, and adjust the current-limiting resistors accordingly.